Every night a room sits out of order, it costs you money nobody is counting.
Provenance turns the walk your staff already do into a record: what failed, how long it stayed down, which vendor was slow, and what that added up to in lost room-nights.
Norfolk
July 2026 · 49 rooms · issued Aug 1
Your condition data is created every day, and every day it dies on a clipboard.
Somebody walks the property. They find a dead TV, a cracked seal, an HVAC unit that keeps failing. It gets fixed, or it doesn't. Nothing is aggregated, so at the end of the year nobody can answer the questions that actually matter.
Questions an owner cannot answer today
- Which rooms keep failing, and for what?
- How many room-nights did we lose to maintenance last quarter?
- Which vendor takes four days to call back?
- What has to be replaced next year, and what does deferring it cost?
Why a spreadsheet never solves it
The data is created on property, by someone holding a phone in one hand. If capture is slower than a clipboard, it does not happen. Provenance is built around that constraint first and the reporting second.
Walk. Flag. Fix. Report.
Four steps, and only the first one takes anyone's time.
Walk
Your inspector opens the checklist on their phone. Everything starts as a pass. They tap only what fails. Works with no signal at all.
Flag
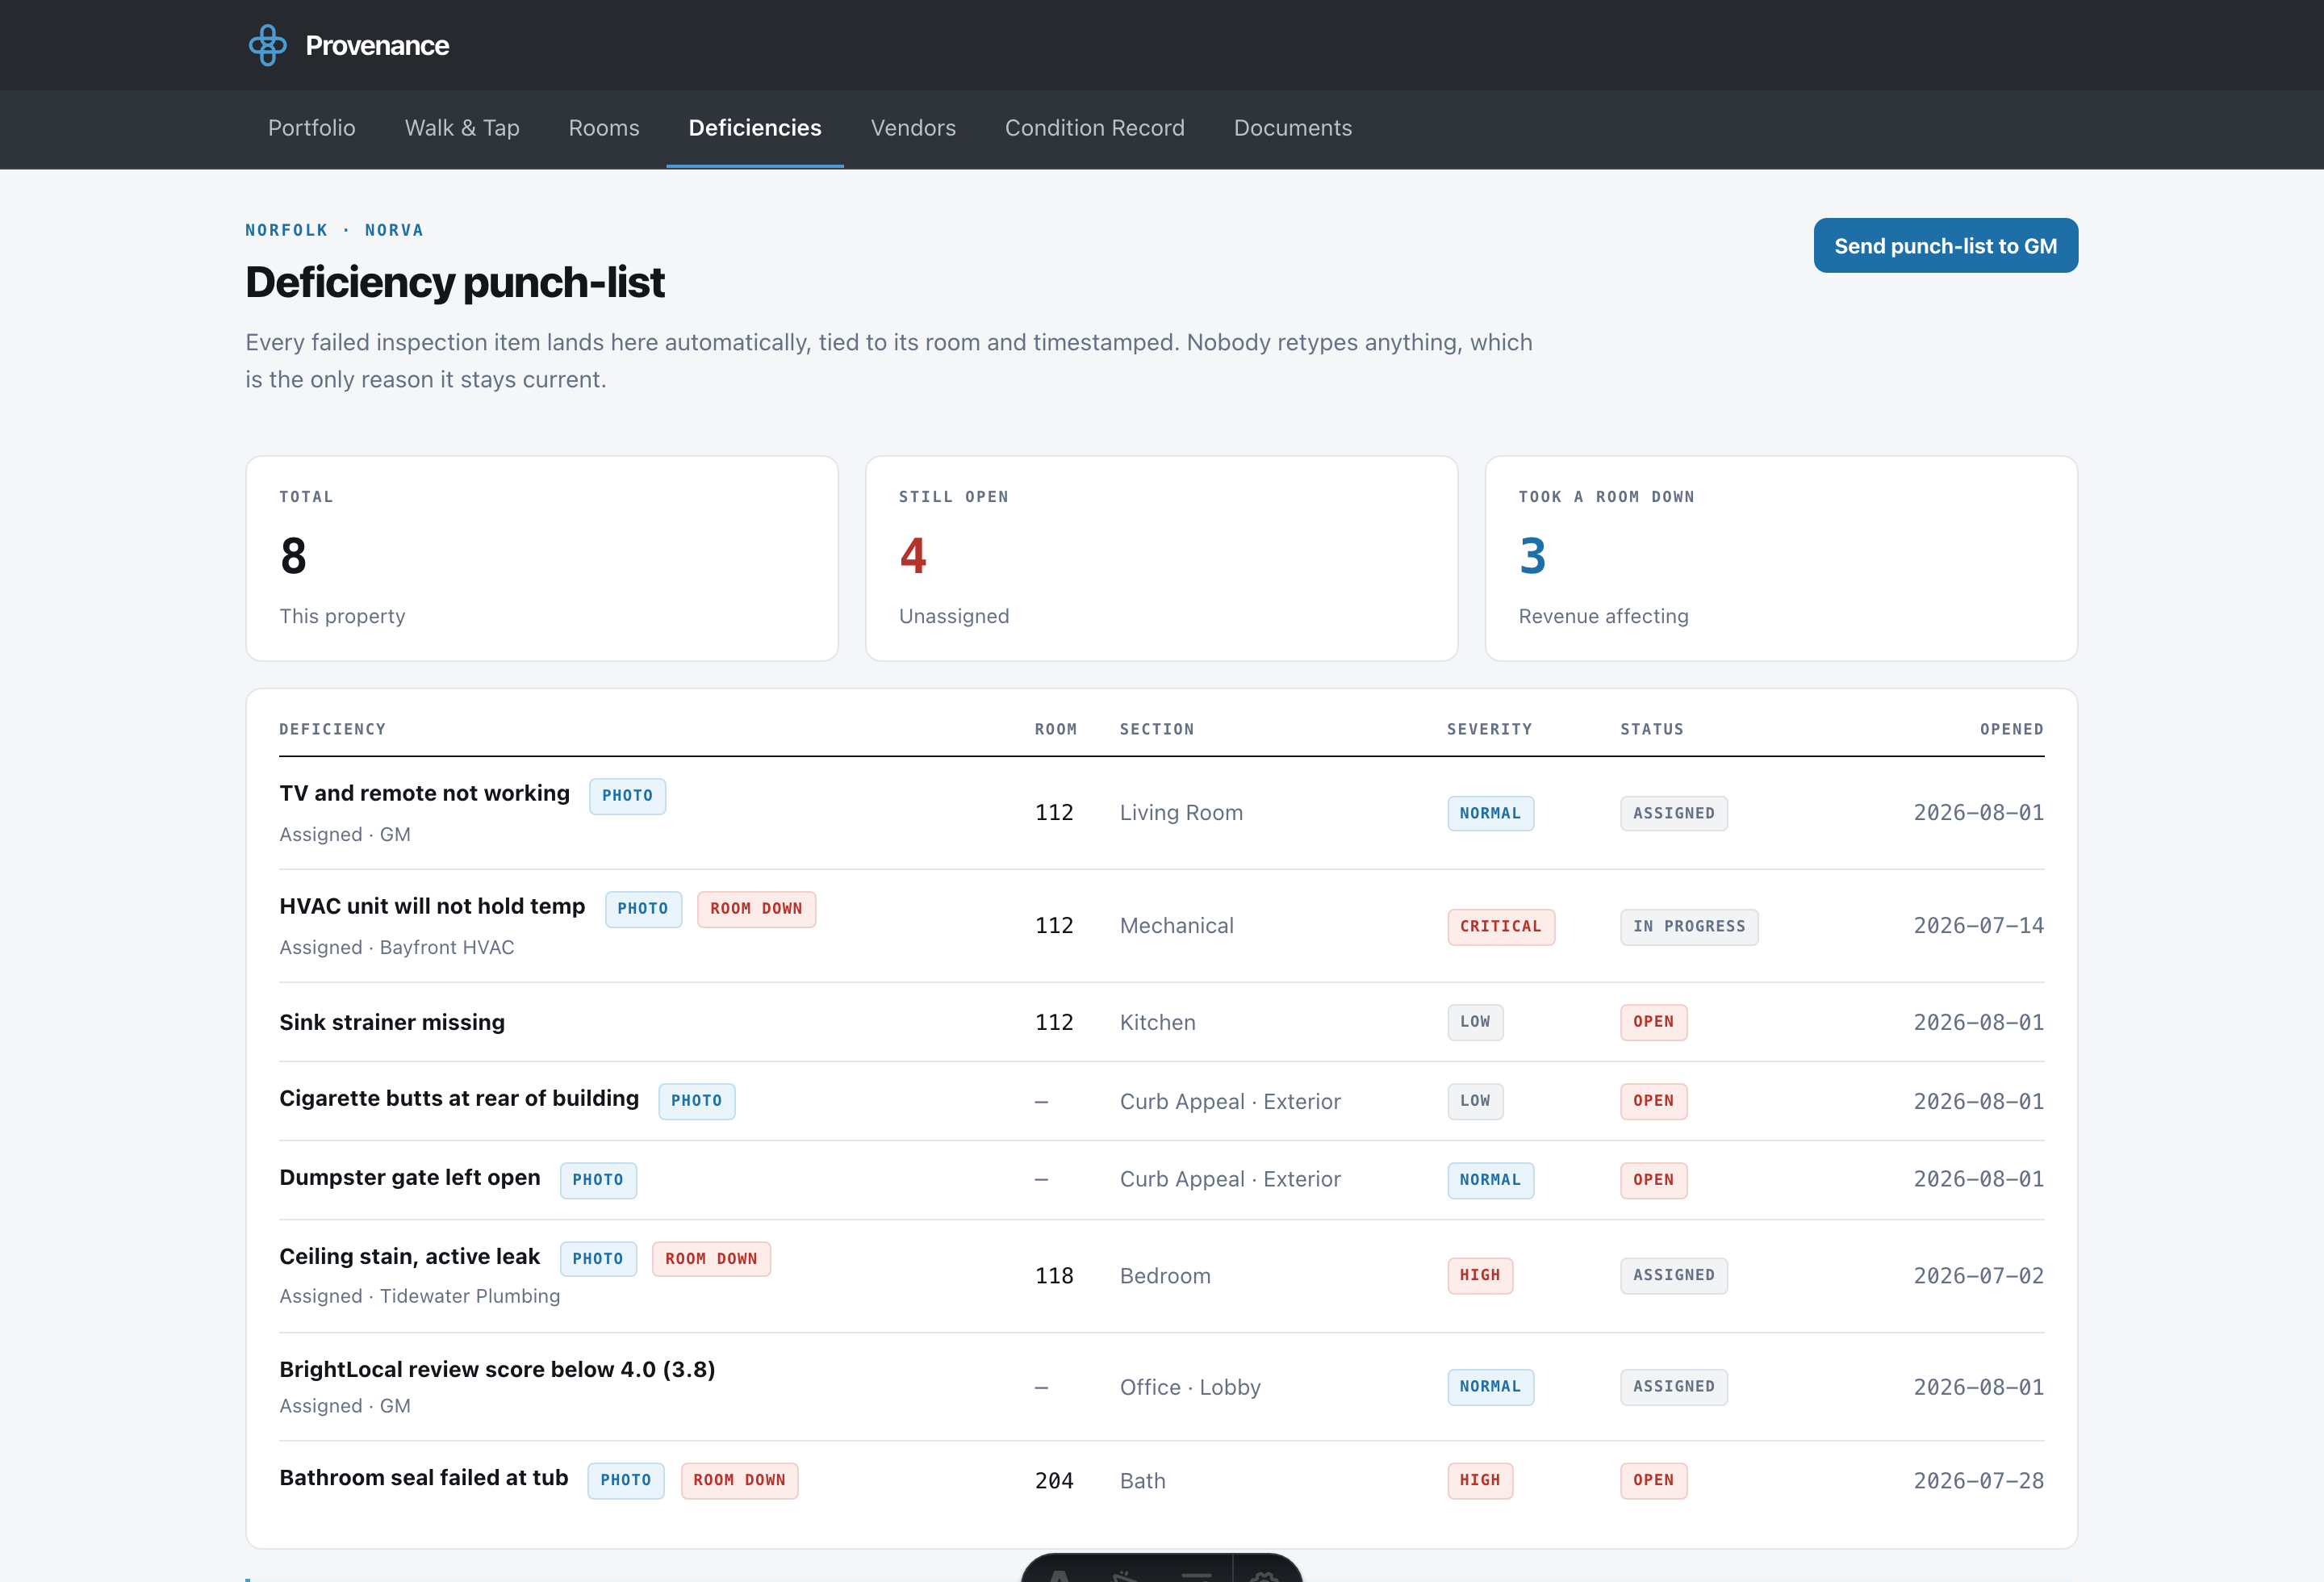
A failure takes a photo in two taps and becomes a deficiency, tied to the room and timestamped. If it takes the room out of inventory, the clock starts.
Fix
The right vendor is one tap away, and the call logs itself against the room. Every contact and every delay is recorded without anyone doing paperwork.
Report
The owner gets one page a month in dollars, not tasks. Rooms down, nights lost, revenue at risk, and which vendors cost the most in delay.
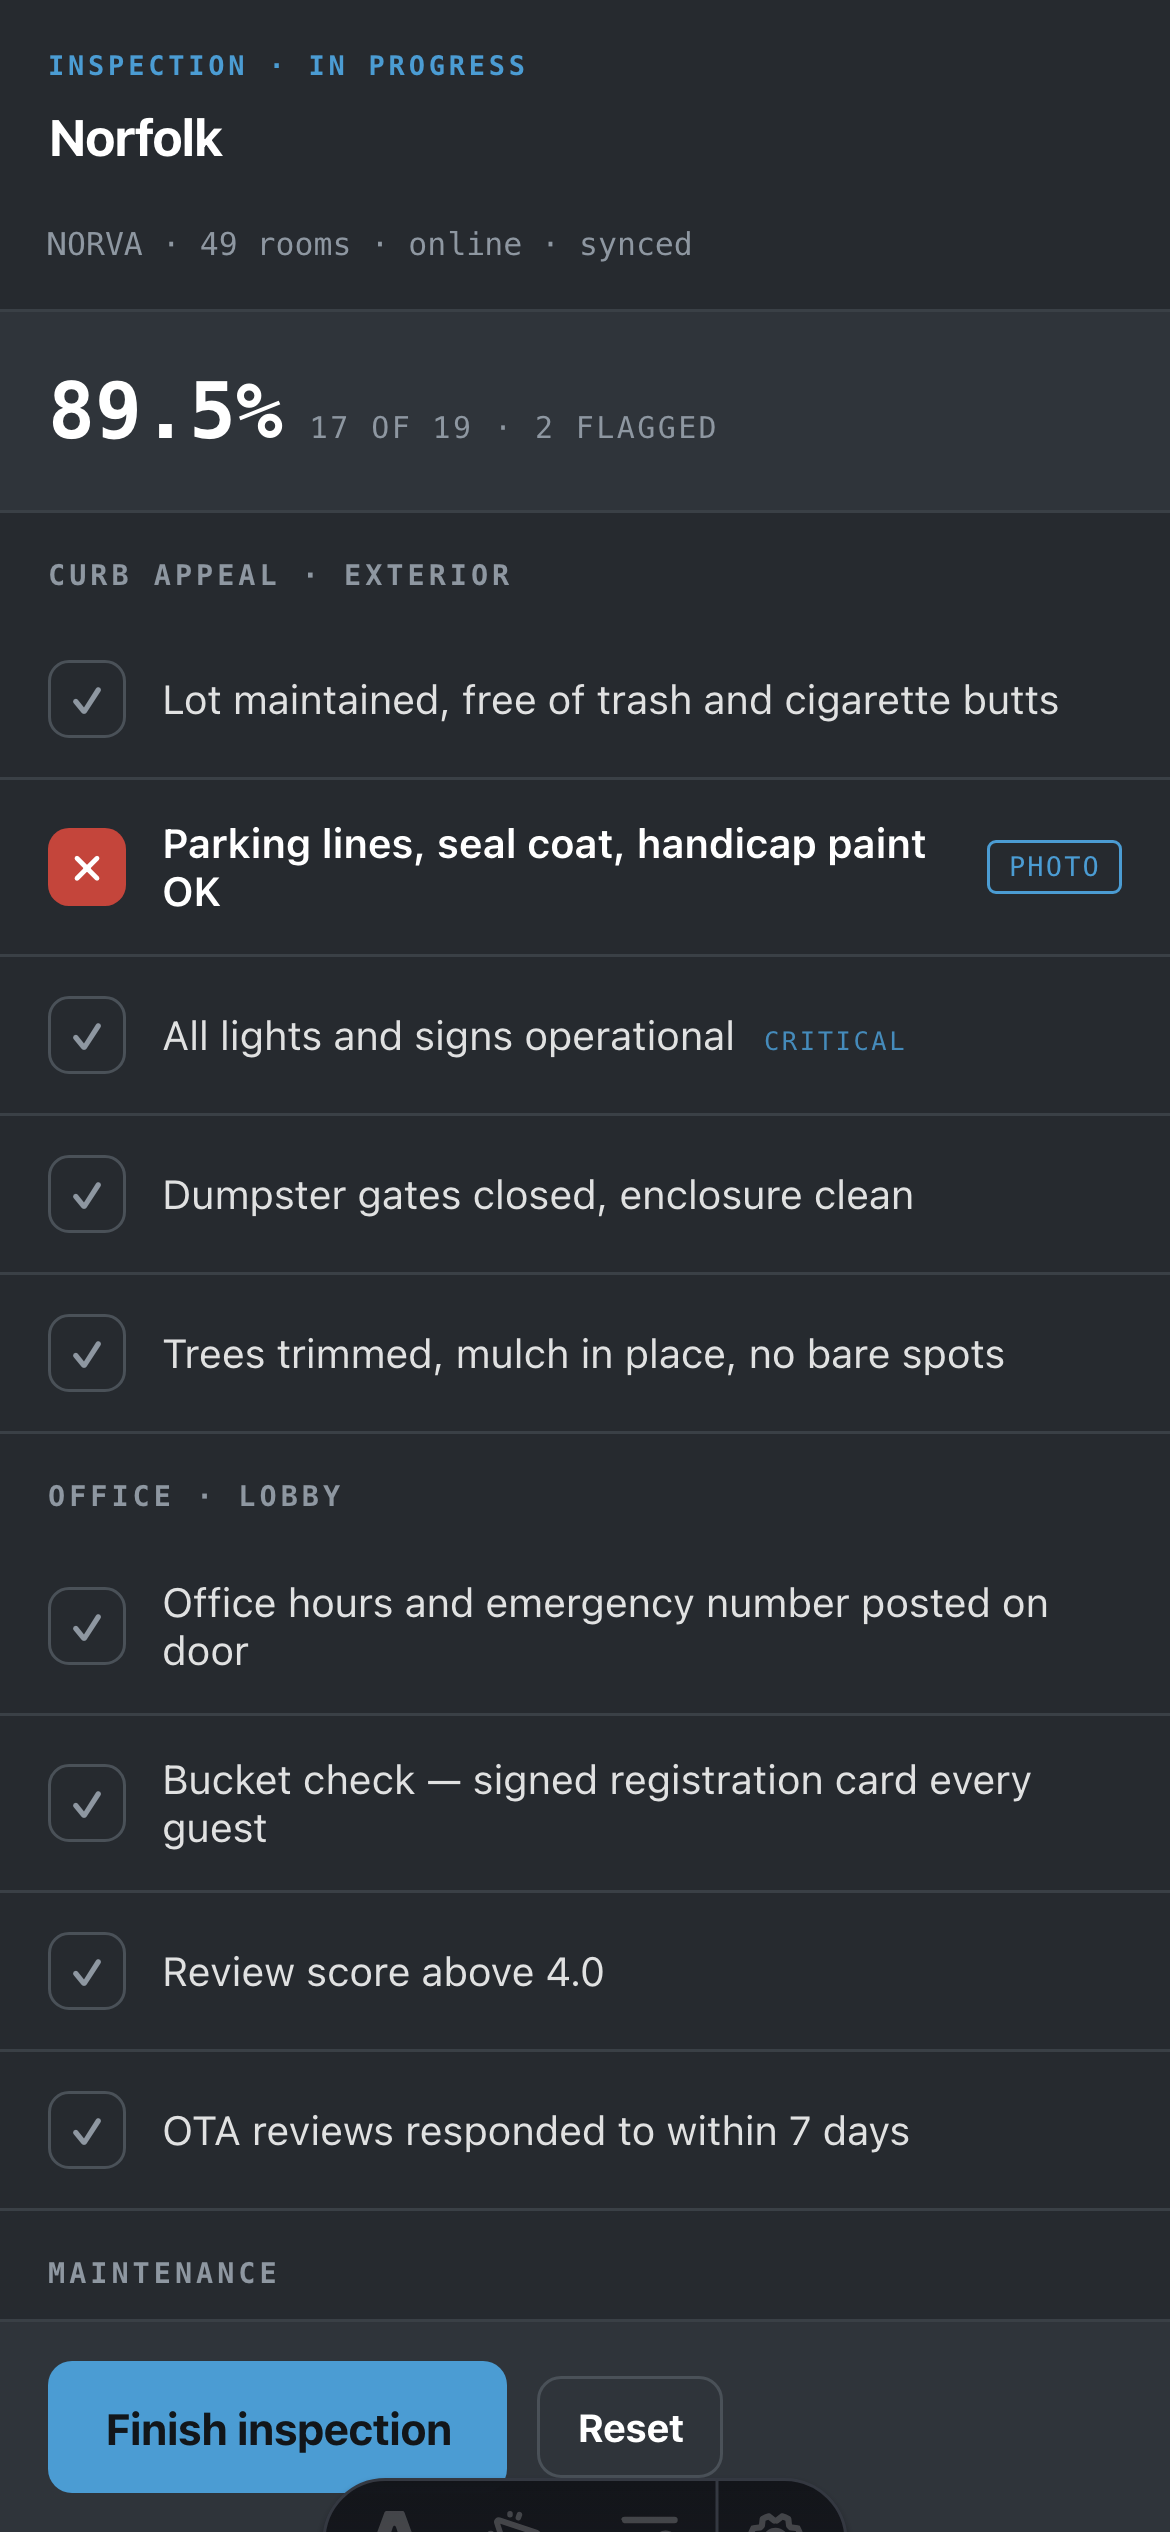
250 items. Two taps.
Every line starts as a pass, so your inspector only touches the exceptions. The score recalculates as they walk, failures flag for a photo, and anything that does not apply drops out of the maths instead of counting against the property.
This is the real screen, captured from the running app. The score reads 89.5% because two items failed and one was marked not applicable, which is exactly how the maths works.
What the walk turns into.
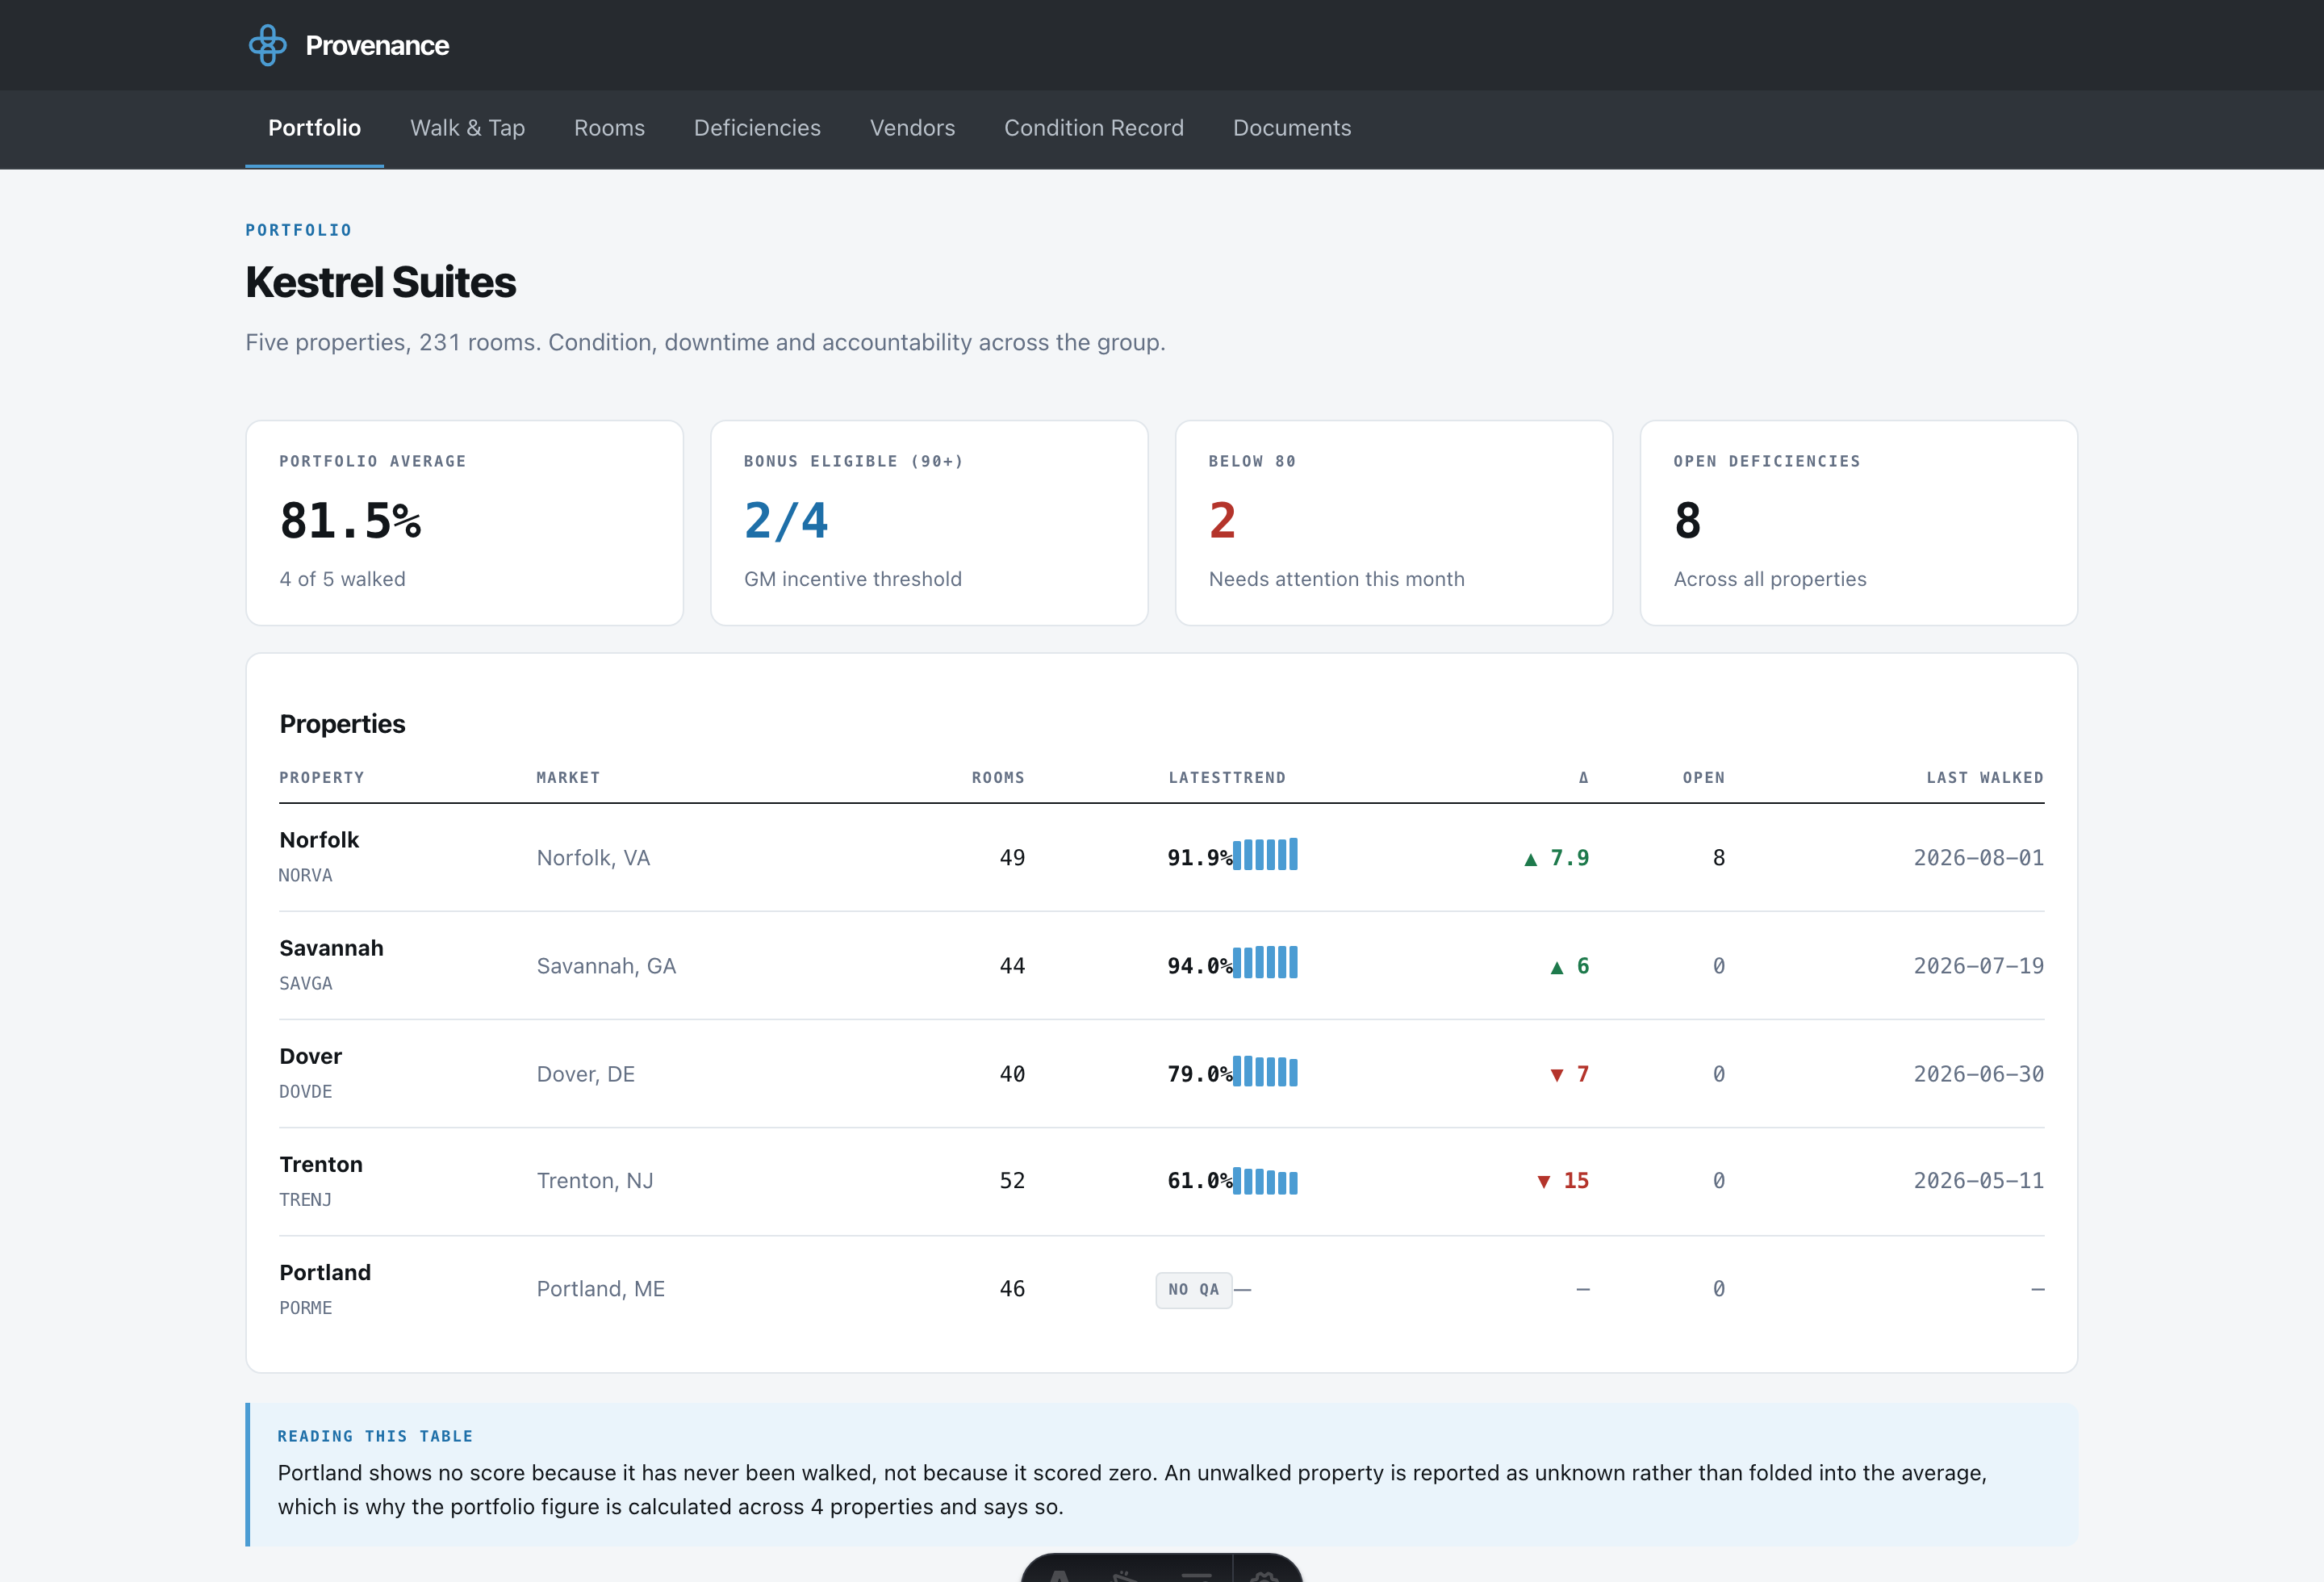
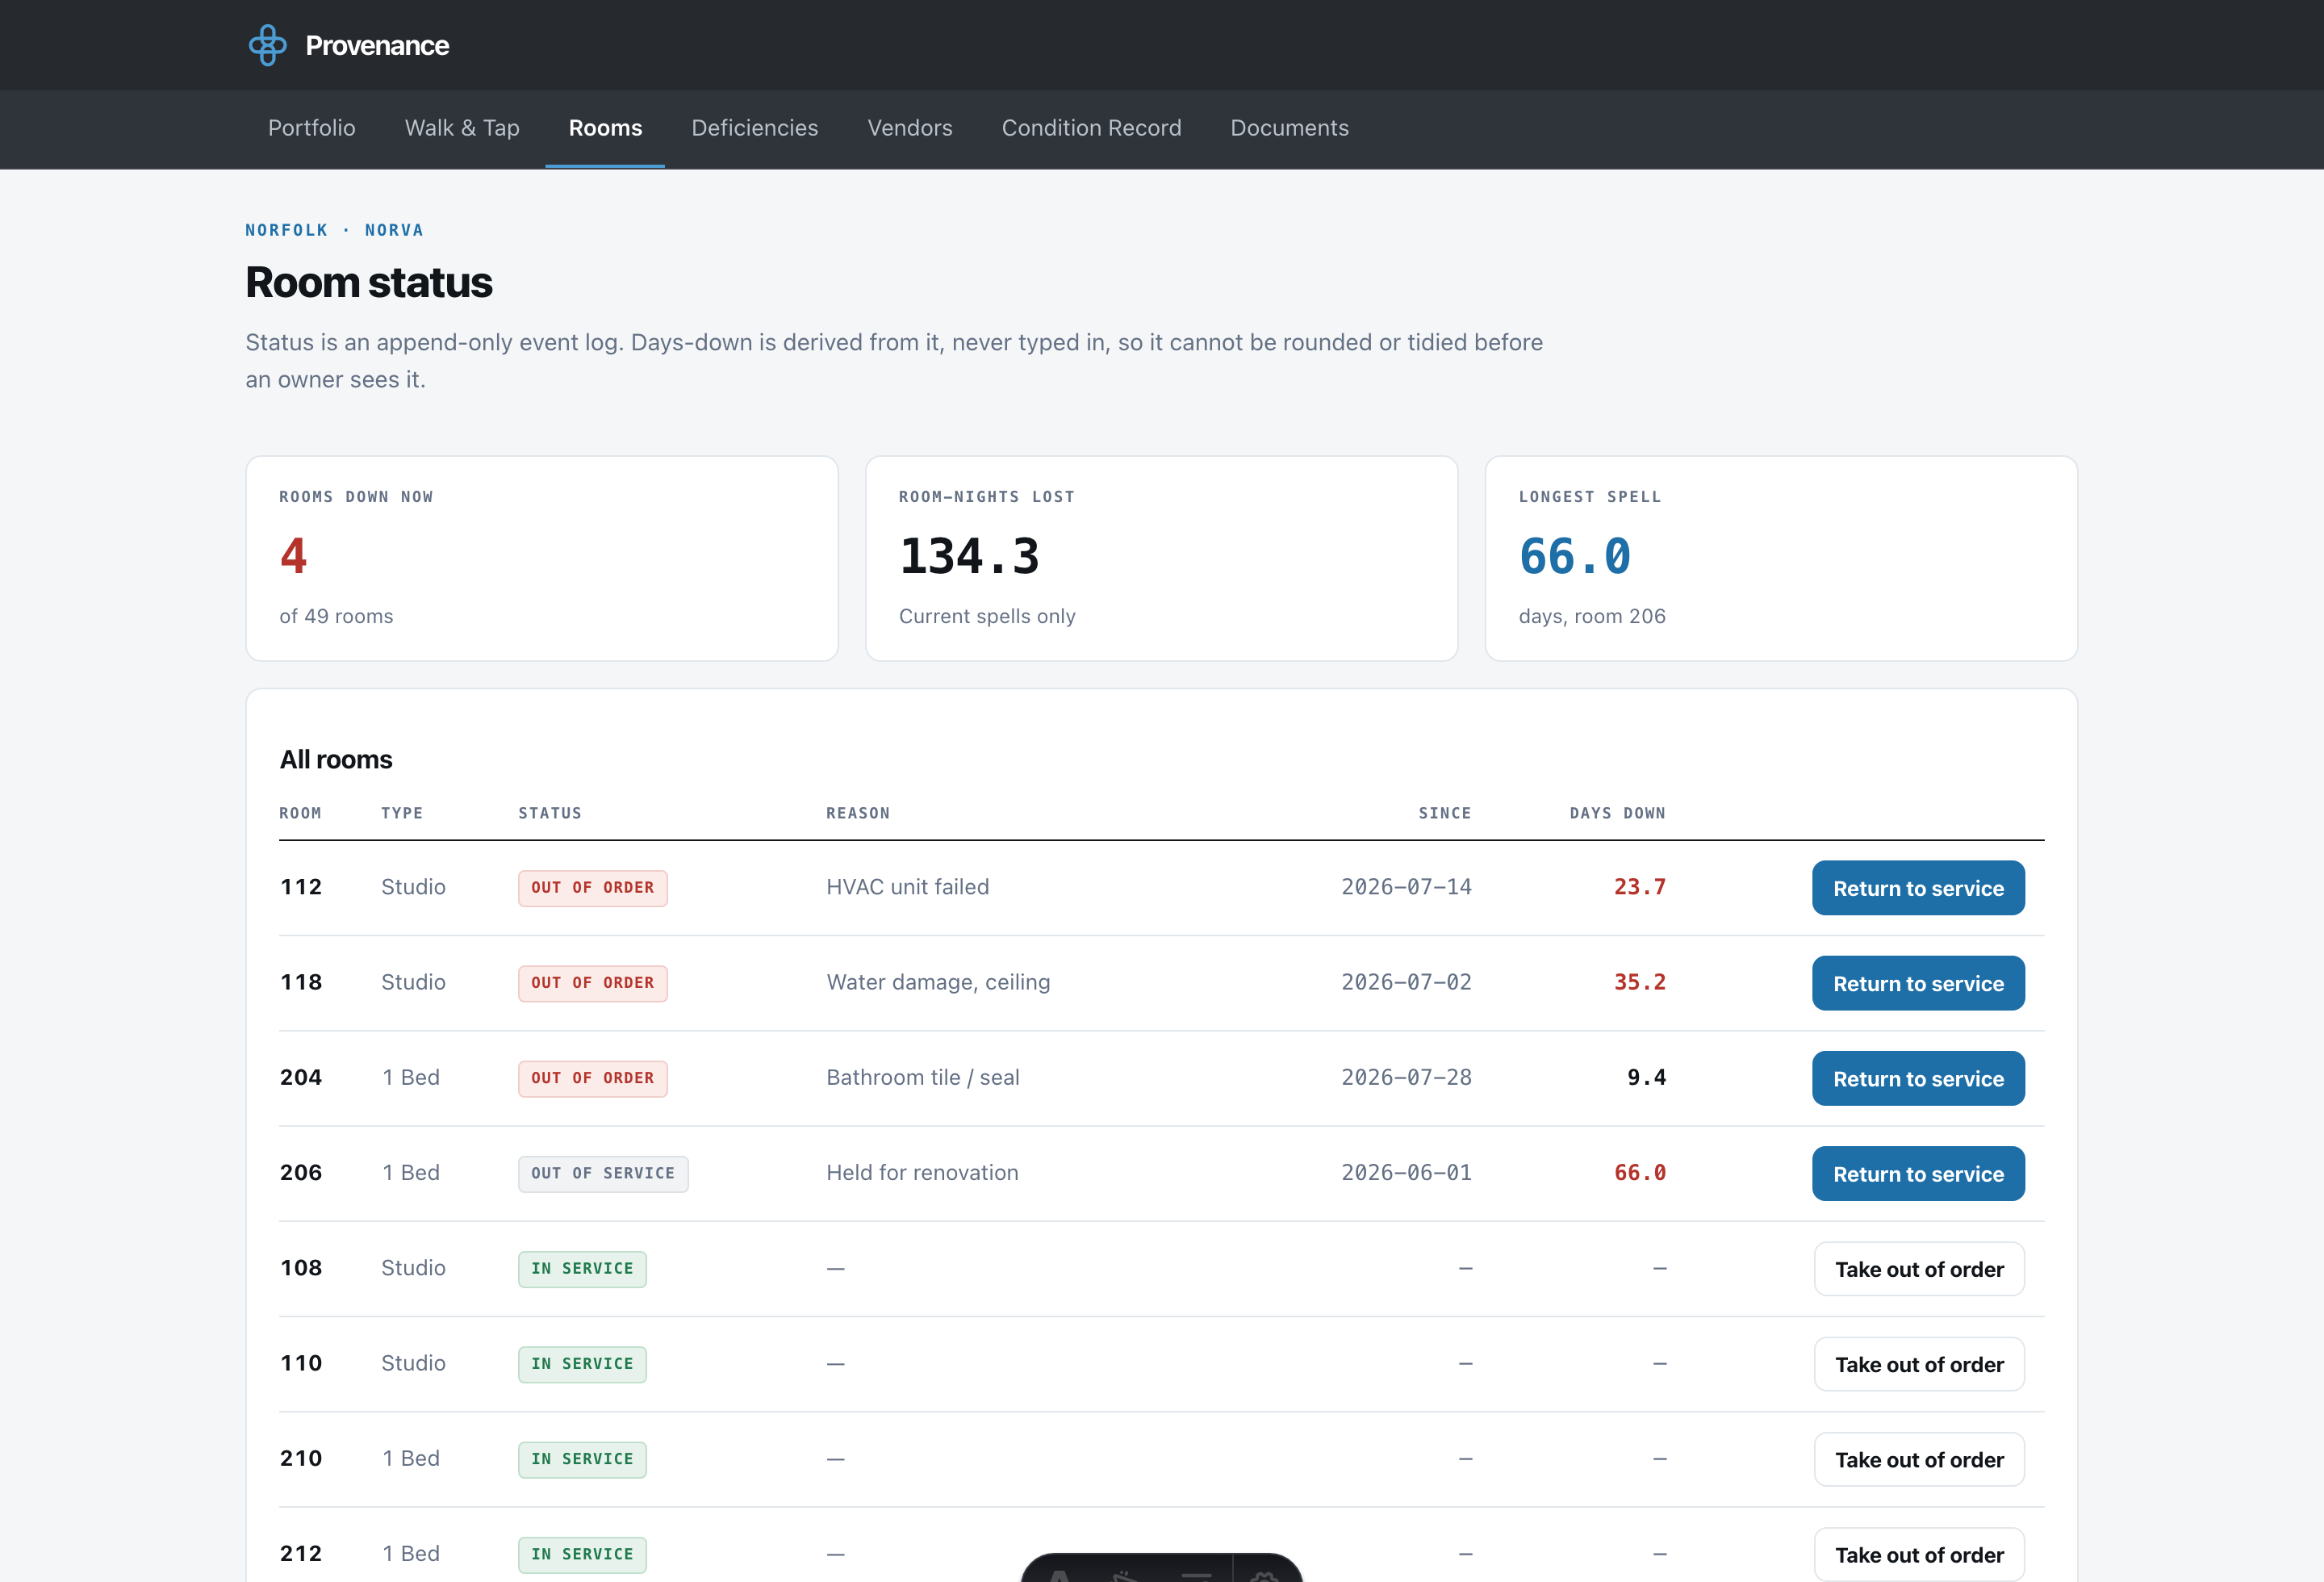
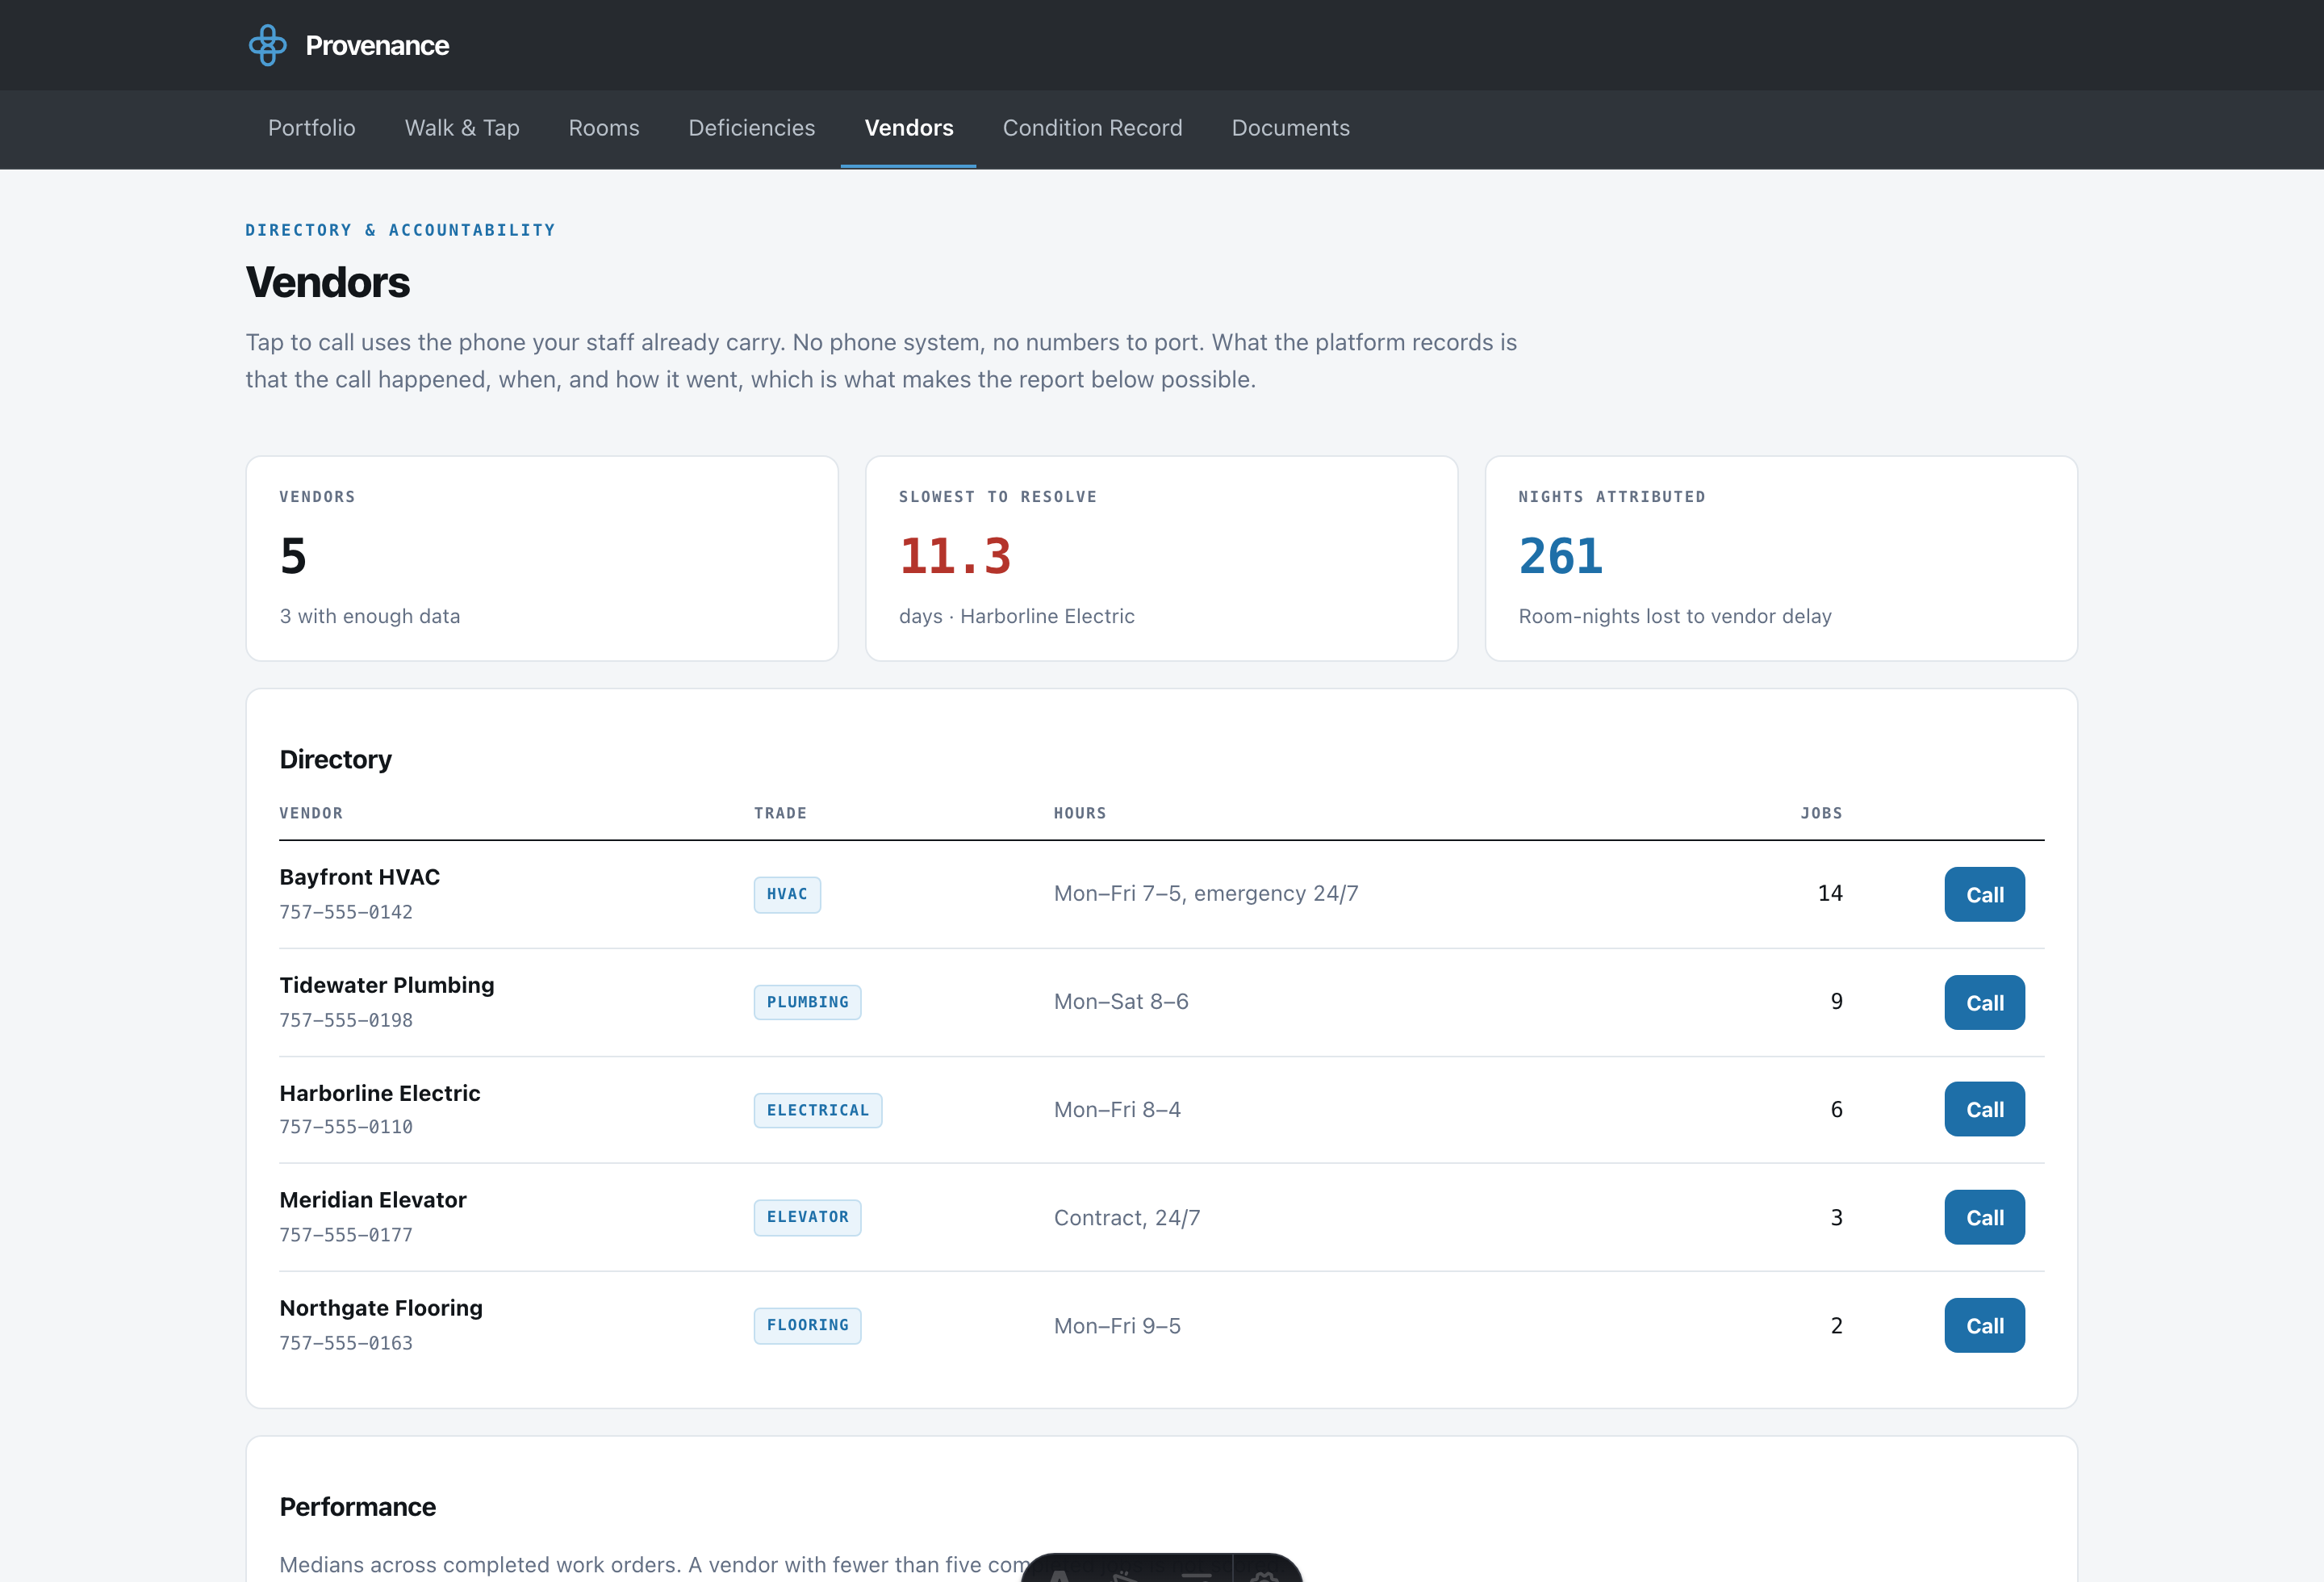
The same data, four ways. Portfolio health, live room status, the punch-list your GM works from, and vendor accountability nobody else is measuring.
One page a month, and it shows its working.
Revenue at risk is room-nights lost times your ADR, and the record prints the multiplication underneath the number so anyone can check it.
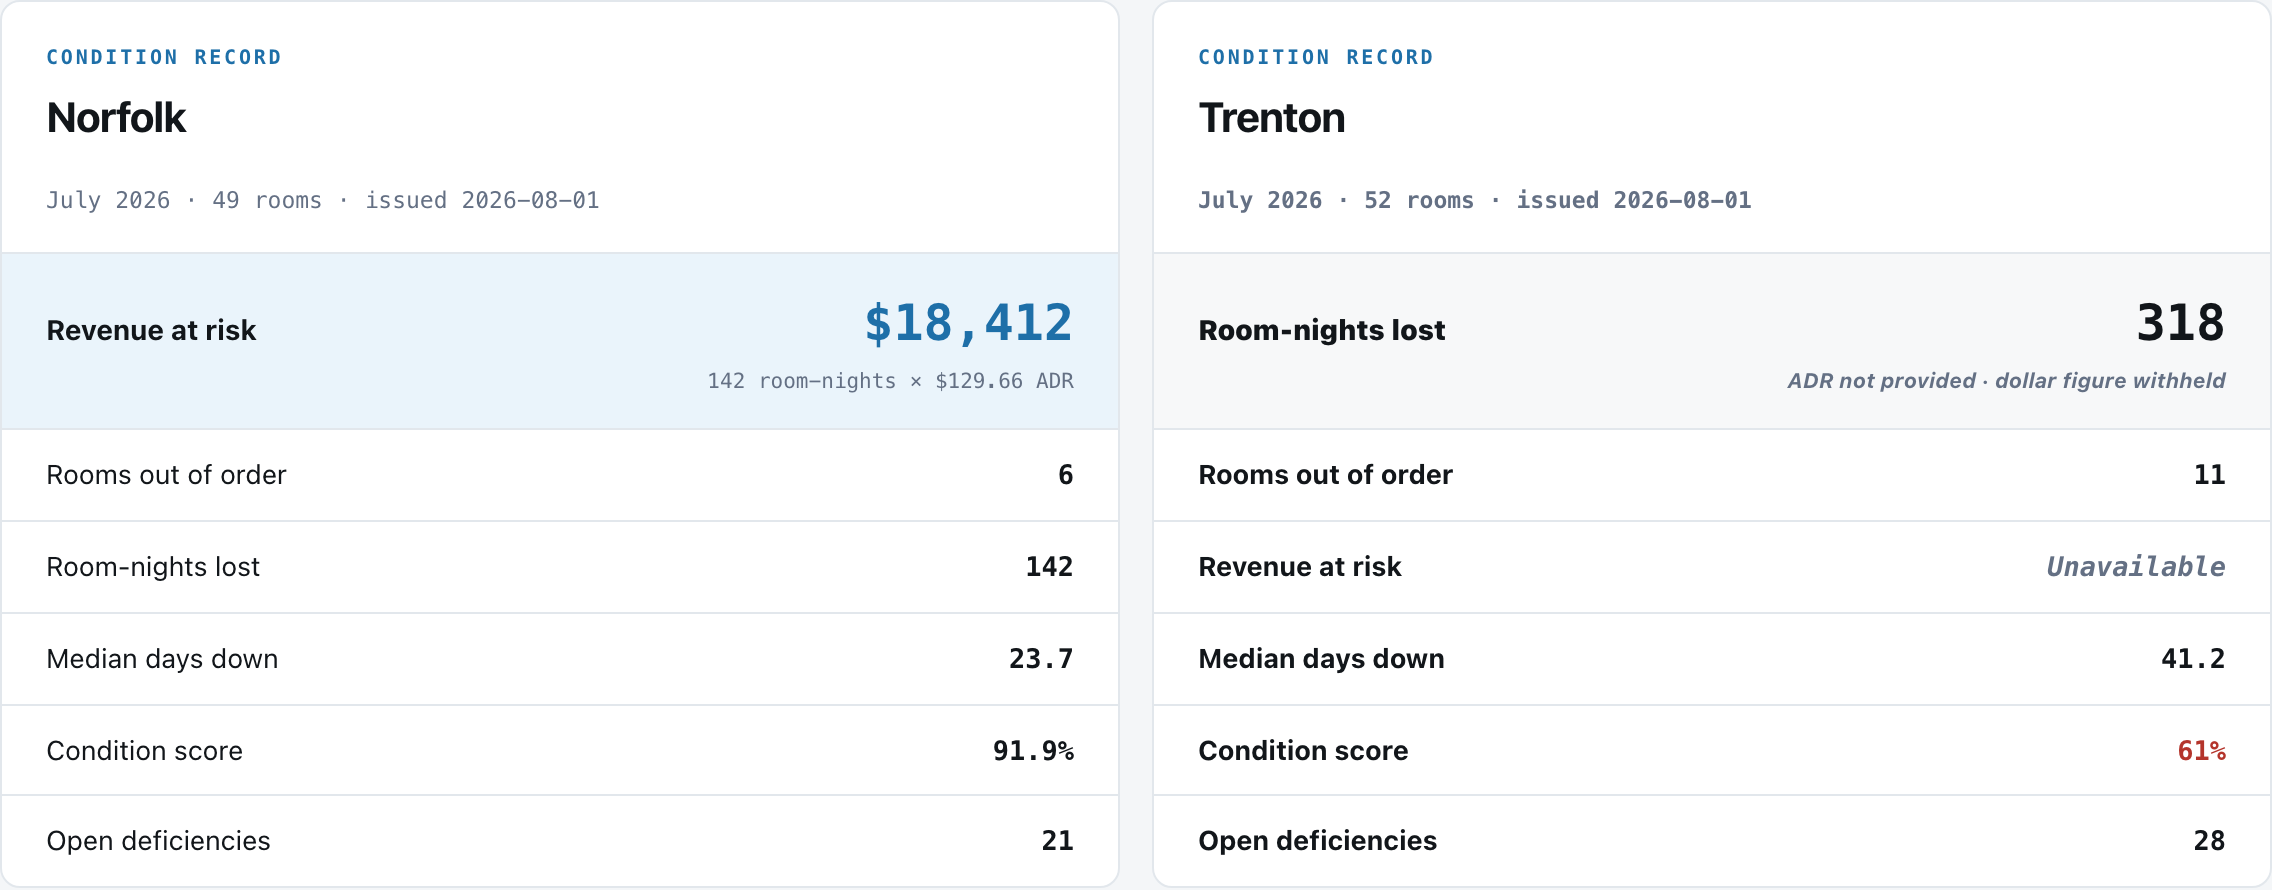
Look at the record on the right. That property has not given us an ADR, so the dollar figure is withheld and the record says so. It does not estimate, infer a market rate, or substitute a comparable. On a document that may end up in a refinance file, one invented number is worse than a missing one.
The same data answers a bigger question every year.
Each level is only possible because of the one below it. That is why starting matters more than waiting for the perfect system.
We will not pretend the capital plan exists on day one. A replacement schedule is only credible with a year or more of real condition history behind it. That is the honest reason to start collecting now rather than next season.
Built for the person who signs the cheque.
Owners
You are not on property every week and you should not have to be. You get one page a month in dollars, and a condition history you can put in front of a lender at refinance or a buyer at sale.
Management companies
You already answer to owners. Provenance gives you a portfolio rollup across every property you run and a reporting artifact you can hand them, so accountability runs both directions.
We are running a small number of free pilots.
Three regional properties, no cost, fixed end date. You get the tool and the reports. We get real conditions to build against and, if it works, permission to say so.